
In today’s era of college baseball, nearly every pitch and every swing is tracked. Exit velocity, launch angle, and swing decisions are tracked with staggering precision, offering deeper insight into how offense is generated. And yet, despite this unprecedented level of analytic opportunity, lineup decisions are usually still made by the same familiar statistics. Batting average, slugging percentage, and OPS (On Base% + Slugging %) are typically the metrics referred to when talking about the success or failure of a hitter. But while these numbers may provide a glimpse into a player’s story, they rarely show the full picture. Leveraging the aforementioned data can provide insights into how an offensive player with an average slash line or counting stats can hold value through underlying attributes like elite contact quality and plate discipline.
In a conference as competitive as the Southern Conference, marginal advantages don’t just matter – sometimes they are the difference between an NCAA Tournament berth and an early finish to the season. Coaches preparing for conference play need every advantage they can find. What if there was a way to combine everything to know about a hitter’s offensive performance into one clear number that provides both precise skill recognition and convenience for coaches?
That very question is what led to the construction of Comprehensive+.
Components
The goal of this project was simple: to create a broad and multi-faceted offensive metric for SoCon hitters. Rather than trying to recreate a Major League model or simply examine box scores over time, this project combed through four years of SoCon Trackman data. Trackman radar-based technology captures detailed information on plate discipline, contact quality, and batted ball characteristics, offering insights into how hitters produce results, not just what is shown in a box score.
The decision to pull data from just SoCon teams was done with a purpose. Every level of baseball has its own extent of uniqueness; certain stats and or generally accepted trends that directly correlate with winning games. Comparing current SoCon players to the past four years of SoCon data will quantify their strengths and weaknesses through a conference-focused lens.
Using this dataset, key offensive metrics were calculated for every qualified hitter (minimum 50 plate appearances), across four seasons. These included:
- OPS: On base percentage plus slugging percentage
- ISO: Isolates the overall power of a hitter
- wOBA: Measures how many bases a hitter generates per plate appearance
- RC: Measures how many runs a hitter generates per plate appearance
- BABIP: Batting average on balls hit in play
- BB%: Percent of plate appearances where a player walks
- K%: Percent of plate appearances where a player strikes out
- Whiff%: Percent of pitches that a hitter swings and misses
- EV: Exit velocity of a batted ball
- EV90: 90th Percentile exit velocity
Each one of these statistics was selected to represent a specific dimension of offensive performance. BB%, K%, and Whiff % showcase swing decision quality. ISO, EV, and EV90 are measures of power. wOBA, RC, OPS and BABIP show overall bases and run production. Together, they form a multidimensional offensive profile.
Standardizing Performance
Raw statistics approach provides a neutral starting point. It avoids overvaluing one category or statistic at the expense of another.
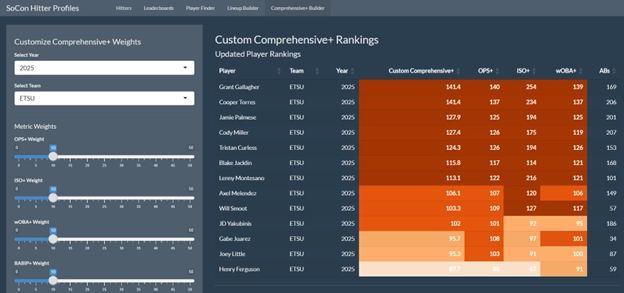
However, in deciding to weigh all components equally, there was another train of thought. Every user of Comprehensive+ may value certain stats differently. One user may place a higher value on OPS while another leans more on EV. Because of this, an option was included to adjust the weights of the components, allowing the Comprehensive+ metric to be tailored to every user’s specific values.
From Calculation to Application: The App
To move beyond the calculation and towards usability, the project was organized through an interactive application, designed for real-time exploration and comparison.
The app serves as the functional deliverable layer of the project. It integrates the Trackman data, season adjusted metrics, and Comprehensive+ calculations into a centralized interface where users can explore, filter, and compare hitters in real time. Rather than using spreadsheets or static reports, the interactive app allows coaches and analysts to interact directly with the evaluation system.
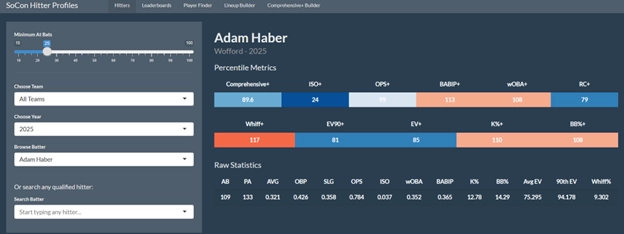
The Player Finder tab enables users to view individual hitter profiles within a selected season. For each qualified hitter, the app displays Comprehensive+, each underlying plus metric, as well as both traditional and advanced offensive stats. This structure is intentional. By continuing to display the other stats along with Comprehensive+, it provides greater context to the number. A hitter with a composite score of 112 may generate his value through elite power. Other hitters may achieve the same score through contact quality and plate discipline. The composite score summarizes performance, but it is the components that explain it.
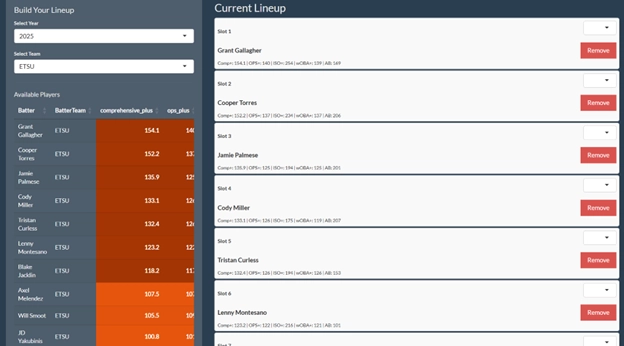
 Beyond individual evaluation, the project also extends into lineup construction. The Lineup Optimizer tab aggregates individual Comprehensive+ scores to identify combinations of hitters that maximize total offensive value. It does not make projections about who will be the best but takes the nine highest Comprehensive+ score based on the filters applied. Another notable limitation is it does not decide the best order of the lineup, but rather orders the top nine players under the applied filters, with the top rated player first and lowest rated player last. While the current version of the optimizer relies on the equal weight Comprehensive+ baseline, it demonstrates how a composite offensive number can inform decision making beyond simple statistical comparison.
Why Is This Important?
Most publicly available advanced metrics are calibrated to Major League Baseball. These tools are sophisticated and often do not translate cleanly to the collegiate baseball environment. By grounding Comprehensive+ in four seasons of SoCon data, this project provides context-specific evaluation specifically built for the conference. This allows hitters to be compared against their peers rather than MLB standards.
By also tailoring this project to the SoCon, it provides a better understanding of what kind of players are in the conference. To use a different example, in Southeastern Conference (SEC) baseball, pitchers throwing in the low to mid-90s is quite common. However, a pitcher throwing that fast in the SoCon is a rarity. This makes it incredibly important to have this number dedicated to the SoCon, to provide more contextually accurate data to coaches and analysts alike.
Limitations and Future Development
While Comprehensive+ does provide a structured number for evaluating SoCon hitters, it is not without its limitations. One of the more glaring limitations is that it is descriptive, rather than predictive. It summarizes part offensive performance but does not give any attempt to forecast future production. Secondly, the equal weight baseline may not reflect the true run value contribution of each offensive component. Although the Builder tab allows users to manually adjust the weights, the other tabs still rely on the equal weight baseline. Expanding the optimizer to incorporate the weight configurations would certainly be a helpful tool. Comprehensive+ also does not attempt to integrate baserunning skill, positional adjustments, or defensive value. It is a purely offensive number targeting hitting. Finally, the model is specific to the Southern Conference. While this is a strength in terms of contextual accuracy, it makes it difficult to generalize. These limitations do not undermine the objective of this project but highlight its role as a foundation for continued refinement and application.
Conclusion
This project set out to answer a focused question: Can a single offensive metric be constructed to build effectiveness in comparing SoCon hitters? Using Trackman data, we determined the answer to be yes. By standardizing key offensive statistics into season-adjusted percentile metrics and combining them into a composite framework, Comprehensive+ provides a transparent, customizable method for evaluating hitters within the context of their league. Through its Shiny implementation, the metric moves beyond theory and into application, offering an interactive tool for player comparison and lineup evaluation.
Comprehensive+ does not eliminate the need for deeper player analysis, but offers a means to organize player comparisons within a given conference. In doing so, the project demonstrates how conference-specific analytics can help translate raw tracking data into structured decision support.
About the Authors
Brooks Bilton is a junior Economics major with concentrations in Data Analytics and Sports Marketing. He’s initially from Lee’s Summit, Missouri, and is passionate about baseball scouting, operations, and analytics. www.linkedin.com/in/brooksbilton
Braydon Bolton is a junior Finance and Management major who will be pursuing a Sports Business MBA upon his graduation in December 2026. He is from Roswell, Georgia and aspires for a career within baseball finance, roster construction, and analytics. https://www.linkedin.com/in/braydonbolton/
Taylor Mansell is a junior Economics major with concentrations in Data Analytics and Sports Marketing. She is from Bethlehem, Georgia and is passionate about baseball scouting and performance evaluation. www.linkedin.com/in/taylormansell7
References
- Major League Baseball. (n.d.). Statcast glossary. https://www.mlb.com/glossary
- Major League Baseball. (n.d.). Weighted on-base average (wOBA). https://www.mlb.com/glossary/advanced-stats/weighted-on-base-average
- Major League Baseball. (n.d.). Weighted runs created (wRC). https://www.mlb.com/glossary/advanced-stats/weighted-runs-created
- Major League Baseball. (n.d.). Isolated power (ISO). https://www.mlb.com/glossary/standard-stats/isolated-power
- Major League Baseball. (n.d.). Batting average on balls in play (BABIP). https://www.mlb.com/glossary/advanced-stats/babip
- Major League Baseball. (n.d.). On-base plus slugging (OPS). https://www.mlb.com/glossary/standard-stats/on-base-plus-slugging
- Major League Baseball. (n.d.). Strikeout rate (K%). https://www.mlb.com/glossary/standard-stats/strikeout-rate
- Major League Baseball. (n.d.). Walk rate (BB%). https://www.mlb.com/glossary/standard-stats/walk-rate
- Major League Baseball. (n.d.). Exit velocity. https://www.mlb.com/glossary/statcast/exit-velocity
- Major League Baseball. (n.d.). Whiff rate. https://www.mlb.com/glossary/statcast/whiff-rate